I am investigating cooperation between the government and opposition parties. Why do some opposition parties oppose government policy while other opposition parties cooperate with the government? Politicians often have an idea of what the ideal government policy should look like. But how important are the opposition parties’ political preferences in their attitude towards the government? I want to know!
How do political parties try to win elections?
Image via Freepik
policy dimensions
When examining the political preferences of parties, political scientists usually look at the parties’ positions on the “dimensions of politics.” It is a difficult concept, but it has a political dimension, as it gathers views on specific policy proposals. Are you for or against building wind turbines, subsidizing solar panels, shutting down coal-fired power plants, using nuclear power, and imposing extra taxes on aviation, driving and meat? Your opinion on this type of topic is usually determined by whether you think the government should take more or less action to combat climate change.
For example, most of the positions held by parties are influenced by general opinions about freedom, individualism, inequality, the role of government in the economy, traditional values, respect for authority, religion, the environment, and so on. By measuring the parties’ positions on the dimensions of politics, it can facilitate comparison of parties with each other and charting the ideological developments of the parties over time.
But how do you properly measure something abstract like a “point of view” or “ideology” and compare it fairly? You cannot directly monitor the preference for a particular policy. And for this you have to rely on the actions of politicians. But as a political scientist, you have a kind of tool to measure the positions of political parties: polls, electoral platforms, and voting behaviour. Part one of this week: polls.
Polls of experts, voters or politicians
One way to gauge party policy preferences is to interview people who have a great deal of knowledge about political parties, for example political scientists who do a lot of research on Dutch politics. They then fill out a questionnaire in which they place the parties on different political dimensions, for example with regard to European integration, abortion or the general scale between left and right. An example of such a survey question is provided below.
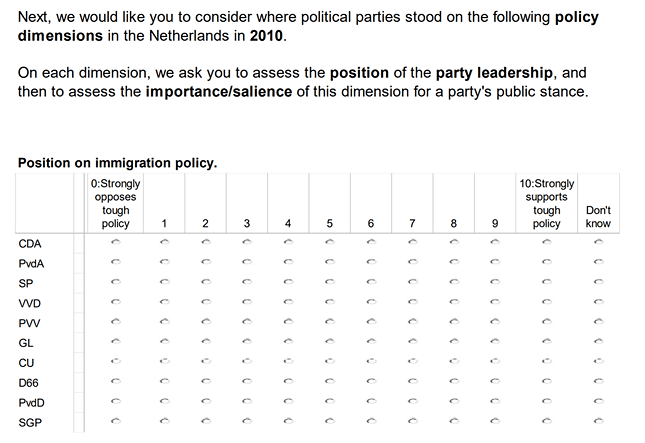
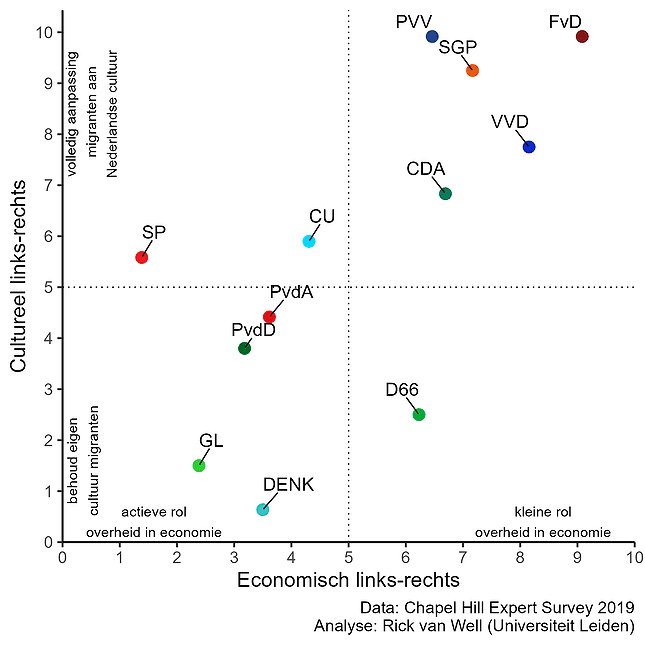
Then you assume that the average of their answers roughly reflects the mutually correct position. In the figure below, I have presented the average answers of 13 experts on Dutch political parties in a figure from 2019 that shows two political dimensions. In the left-right economic dimension, “left” denotes an active role and “right” denotes a smaller role for government in the economy (eg privatization, tax cuts, fewer regulations, less government spending, smaller welfare state). The left-right cultural dimension focuses on issues surrounding a multicultural society, with the “left” advocating the preservation of the immigrants’ own culture and the “right” advocating the immigrants’ full adaptation to Dutch culture.
Rick Van Wiel for Nemo Kineslink
What is striking is that most parties combine the views of the economic left with the cultural left, or the economic right with the views of the cultural right. Only D66 combines a moderate preference for a modest role for government in the economy and a preference for a society in which different cultures coexist on equal footing. According to these experts, the Socialist Party prefers an active role for the government in the economy, while it occupies a middle position in the cultural dimension.
The surveys are extensive
Not only do expert political scientists bother with these kinds of questions, but also ordinary people, for example Extensive surveys held around the elections. Somewhat less regularly, political scientists also subject MPs themselves to this type of research. In 2017 I was allowed to participate in Seventh Parliamentary Inquiry Since the 1960s, they have asked members of parliament for their opinions on certain topics, among other things.
This makes it possible to conduct all kinds of interesting research, which includes, for example, opinions voters with deputies can be compared. This indicates that the largest group of voters is economically left-wing and culturally right- (upper left quadrant in the figure)-but hardly any MP or party takes this position. Interesting puzzle!
A disadvantage of using these expert or voter estimates is that it is not always clear what they are based on. And in the UK, the Liberal Democrats were more to the right in 2010 than ever before, while the party’s election manifesto has never been more right. The poll was conducted immediately after the Liberal Democrats formed a coalition with the Conservative Party. This raises doubts about whether these types of measurements depend not only on parties’ political preferences, but also on their behaviour. And I want to explain this behavior, whether or not the parties cooperate with each other, on the basis of their political preferences. This is why I am also looking for other ways to gauge the parties’ positions. Next time: Analyze electoral programmes.