Discussions about the distribution of prize money in snooker often boil down to many opinions being expressed, with one (and often random) statistic added for good measure.
In this article a more structural and objective analysis of relevant data, by Wim Hordecke
seems there Endless discussions About the distribution of snooker prizes. These discussions often boil down to lots of opinions, with one (and often random) statistic added for good measure. However, there seems to be no more structured and objective analysis of the relevant data.
So I decided to look at this data myself, and do some statistical analysis. What in particular interested me was: (1) how much big players dominate the prize money rankings, and (2) how much they are dominated by players from the United Kingdom (UK; ie England, Scotland, Wales, and Northern Ireland). Both questions have been asked (again) in connection with the recent match-fixing scandal.
With prize money rankings spanning more than four decades as a dataset (obtained via cue tracker), starting with the 1980-1981 season and ending with the 2022-2023 season, I produced several charts and conducted several statistical analyses. In this article I will highlight the two most important findings and conclusions. The full analysis, including all data and results, is available at Preprints.org.
Let’s start with the distribution of the prize money itself. The graph below (called ‘histogram’) compares these distributions for the first (80/81; dark blue) and last (22/23; light blue) season in the data series. For example, this graph shows that during the 80/81 season there were 45 players who won an amount between 0 and 10,000 (first leftmost dark blue bar), 5 players who won an amount between 10,000 and 20,000 (second dark blue bar left), and so on. The last light blue bar on the far right represents the 8 players who earned over 250,000 during the 22/23 season. (All amounts are in pounds sterling or pound sterling.)
This graph confirms what we already knew: the prize money distribution is very “skewed”, with a few players earning too much each, and a large number of players earning too little. Obviously, this is not uncommon in professional sports. But during the 22/23 season, half of the players earned less than 20,000, and about a third earned less than 10,000. (This is the actual prize earned, regardless of the 20,000 minimum income guarantee that was introduced last season.)
However, prize money has clearly (and radically) increased over the past four decades. In the 80/81 season, a snooker player earned an average of 5,000, while in the 22/23 season it was 50,000. But with such a skewed distribution, the simple average unfortunately says relatively little, especially considering that three-quarters of the players earned Below this average (and many of them are slightly below).
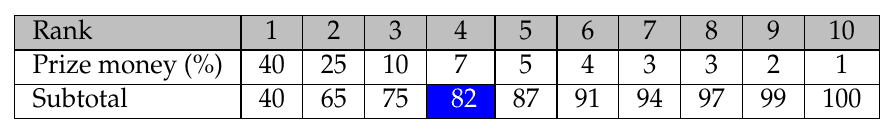
The most important metric is how much the top players dominate the prize money rankings. This can be expressed, for example, by what I have called “rank prize money 80%”. To calculate this, the prize money earned by each player in the standings is first converted to a percentage of the total prize money amount (for all players combined). These percentages are then added to the subtotal, starting with the player with rank 1, then rank 2, and so on. So this subtotal adds up to 100 if the percentage of the last player in the standings is also added. Then the “80% prize money rank” is that rank for which this sub-total is 80% or more for the first time. The table below provides a simple (hypothetical) example with 10 players, where the “80% prize money rating” is 4 (indicated in blue). In other words, the top 4 players combined took over 80% of the total prize pool.
The following graph shows the result of the snooker rankings. The horizontal axis shows the total prize money, and the vertical axis shows the “80% prize money ranking.” Each blue circle represents one of the 43 seasons in the data series. The “80% prize money rating” ranges from just over 10 to over 50, but on an upward trend as the total prize money amount increases. In other words, as the overall prize money amount increases, the ‘80% prize money rank’ generally increases as well. This means that the order then less It is dominated by the big players, as it takes more of them to win 80% of the total prize pool.
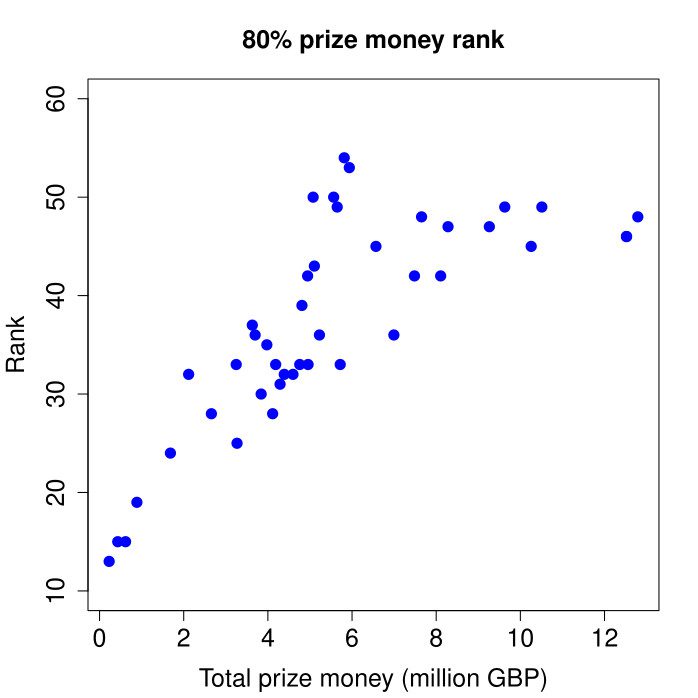
A larger total amount of prize money is of course good for everyone, but speaks relatively more to players lower in the rank. This conclusion been painted before, but through a more mathematically complex analysis. The current (and simpler) analysis confirms this earlier conclusion, and is also based on a more complete data set.
Finally, the graph below shows how much players from the UK dominate the rankings. The dark blue line represents the percentage of players in the ranking from the United Kingdom. This percentage ranges between 50% and 90%. The light blue line represents the percentage of total prize money earned by players from the United Kingdom. This percentage ranges between 70% and 90%.
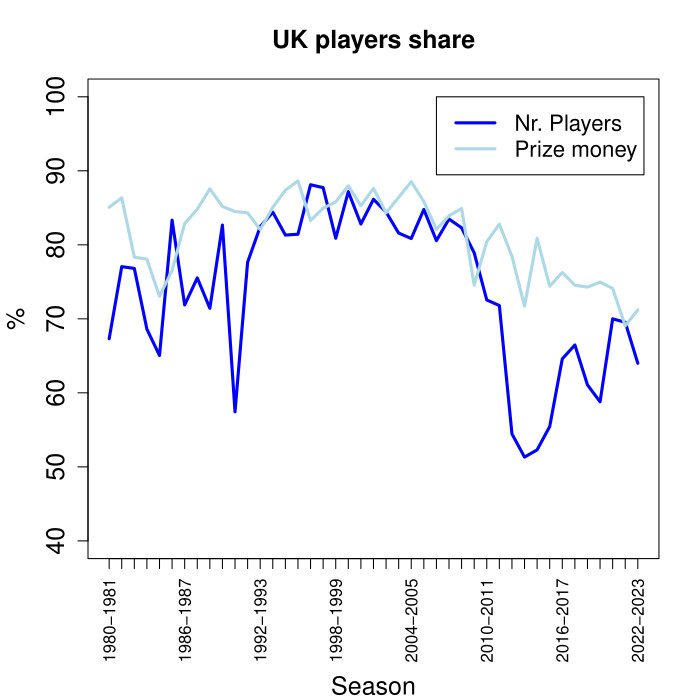
What is remarkable is that the light blue line always stays above the dark blue line (with a few exceptions). In other words, the percentage of prize money won by players from the UK is generally greater than the percentage of the players themselves. Averaged over the 43 seasons in the dataset, the percentage of players from the UK is 74%, and the percentage of prize money they have earned is 81%. A standard statistical test (called a t-test), indicates that this difference in means is very significant. It can therefore be concluded that players from the UK have historically received a larger share of the prize money than could reasonably be expected based on the percentage of players.
I will leave it to the readers themselves to come up with reasons for this, draw further conclusions, and build opinions around them. We hope that the results of this analysis will form an objective basis for this, as well as for any further discussions about the distribution of prize money in snooker!
William Hordec He is an independent and multidisciplinary scientist, originally from Rotterdam, and currently living in Vienna. He has been a fan of snooker since the BBC was first able to be received via cable in the Netherlands in the second half of the 1980s.